Norwich sits on a chalk bedrock covered by glacial sands, gravels, and the occasional brickearth cap — it's a layered sequence that looks predictable on a map but hides plenty of irregularities underground. The chalk itself can be riddled with dissolution pipes and soft putty zones where percolating groundwater has eaten away the calcium carbonate over centuries. Vertical Electrical Sounding (VES) gives us a way to trace these contrasts in resistivity without digging a single test pit. We run current through four electrodes at expanding spacing, measuring how the subsurface resists flow, and from that we reconstruct a layered geoelectric profile down to 30 or 40 metres. In Norwich, where a housing estate might straddle a buried channel of dense sand while the next street over hits weathered chalk at two metres, this kind of reconnaissance makes the difference between a straightforward foundation design and an expensive surprise. For a broader picture across larger sites, MASW surveys complement the resistivity data with shear-wave velocity profiles that help correlate soft zones identified electrically.
In Norwich, a resistivity survey often reveals more about the chalk's condition than a borehole log — it's the lateral continuity that tells the real story.
Methodology applied in Norwich
Local geotechnical conditions in Norwich
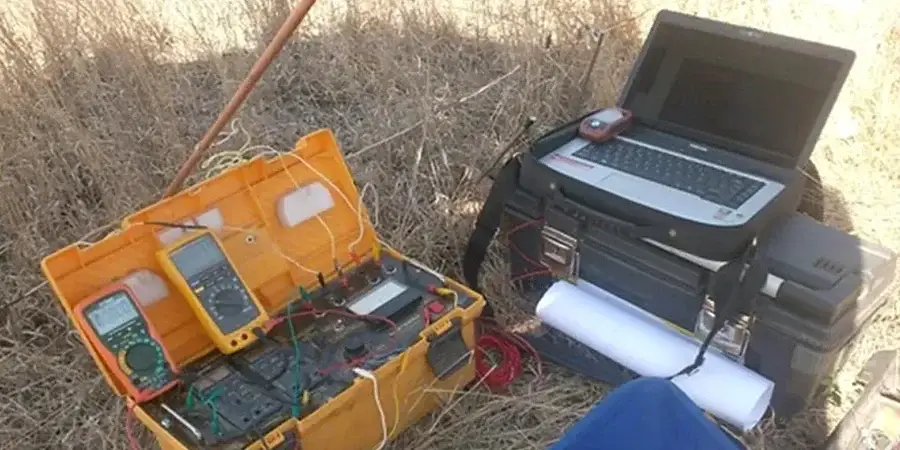
The gear we bring to a Norwich site looks deceptively simple — a resistivity meter in a weatherproof case, four stainless steel electrodes, a hammer for driving stakes into stiff glacial till, and a couple of cable reels — but what happens if the ground contact is poor makes all the difference. Dry sandy soils on a hot summer day on Mousehold Heath can give contact resistances high enough to swamp the signal, so we pre-soak electrode positions with a brine solution and check each stake with a contact-resistance meter before running the full sounding. Urban sites with buried activities, reinforced concrete slabs, or metal fencing generate cultural noise that distorts the electric field; we map all metallic features on a site plan before laying out the spread and orient the array perpendicular to potential interference sources. The biggest technical risk is interpreting a low-resistivity zone as water-saturated sand when it's actually a clay-filled dissolution pipe in the chalk — getting that wrong can lead to differential settlement predictions that miss the mark by a wide margin.
Our services
Every VES survey in Norwich gets paired with practical ground-truthing so the geophysics doesn't float in isolation. Here's how we typically combine resistivity with other investigation methods:
VES profiling with borehole calibration
We run multiple VES soundings across a site and tie each one to a nearby cable-percussive borehole or trial pit. The borehole gives us a physical log of chalk grade, sand density, and groundwater strike; the VES extends that point information laterally so we can interpolate between boreholes with confidence. Reports include geoelectric cross-sections and interpreted depth-to-chalk contours ready for foundation design.
Resistivity mapping for dissolution hazard assessment
In areas of Norwich underlain by the Upper Chalk — particularly the Cringleford and Eaton zones — we run gridded VES or 2D resistivity imaging to delineate low-resistivity anomalies that suggest dissolution pipes or softened chalk. Combined with historical sinkhole records from the British Geological Survey, this provides a defensible basis for foundation depth recommendations and ground treatment specifications.
Questions and answers
What does a VES survey in Norwich typically cost?
For a standard VES sounding with Schlumberger array to 30 metres depth and a full interpretive report, prices range from £430 to £780 depending on site access, number of soundings, and whether we need additional ground-truthing with trial pits. A multi-sounding campaign across a larger site with cross-sections and depth-to-chalk contouring sits at the upper end of that range.
How deep can electrical resistivity testing go in the chalk around Norwich?
With a maximum AB/2 spacing of 100 metres using the Schlumberger array, we routinely investigate to 30–40 metres depth. That's deep enough to see through the glacial cover, the Crag Sand if present, and well into the Upper Chalk — far past any typical foundation influence zone for buildings up to four or five storeys.
Can VES distinguish between dry sand and weathered chalk?
Yes, usually quite clearly. Dry glacial sand and gravel in Norwich typically show resistivities above 200 Ω·m, often much higher, while weathered or putty chalk sits in the 20–60 Ω·m range. The contrast is strong enough that the inversion model picks up the boundary reliably. Where the distinction is ambiguous — for example, clay-rich Crag Sand versus reworked chalk — we calibrate with at least one borehole or dynamic probe to anchor the geoelectric interpretation.
How long does a VES survey take on a Norwich site?
A single VES sounding with setup, electrode contact testing, measurement, and pack-up takes about 45 minutes to an hour on a typical Norwich site with reasonable ground conditions. A full day with a two-person crew can complete four to six soundings, depending on how much walking is involved between stations and whether we're dealing with hardstanding that slows electrode installation.